NR716 Week 7 Quiz | Statistics
NR716 Week 7 Quiz | Statistics
Question 1
8 / 8 pts
Using the interactive statistical flowchart, please select the term that is described by data that is unconnected and distinct and separate. The level of measurement is Nominal and Ordinal. Some examples are first or second place in a horse race or in a Highschool class rating, or numbers of children born in a family. Some other examples are married and not married, high school graduate or not a graduate. Have a look at NR716 Week 8 Discussion | Reflection on Learning and Practice Readiness.
Monodicotoumous data
Correct!
Discrete data
Measured data
Random sampled data
Question 2
8 / 8 pts
The DNP student is conducting data collection at the end of the implementation cycle in her DNP project. She collected categorical outcome data. Using the DNP flow chart for selecting common descriptive statistics, what types of statistical tests will he conduct on his data?
Correct!
Median, Mode, Frequency
Mean, Range, Variance
Dunn’s test and Chi-Square
Kruskal-Wallis and Dunn’s test
Question 3
8 / 8 pts
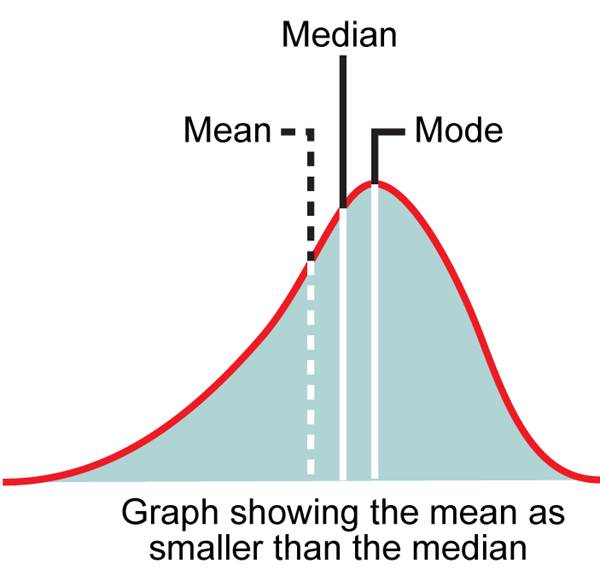
A Ph.D. nurse performs an experiment testing the frequency and correlation of the participant demographics. She plots a histogram measuring income versus education level. She produces the following graph below. Which of the following describes this distribution?
Normal
Bimodal
Correct!
Left Skewed
Right Skewed
Question 4
8 / 8 pts
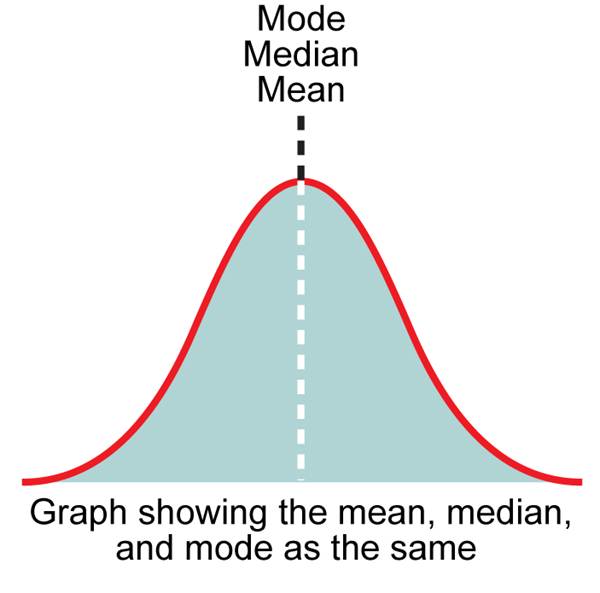
Using the interactive statistical flowchart, what is the definition of a normal data distribution curve?
The data are arranged in a straight horizontal line. The data are 3 standard deviations away from the mean.
Correct!
The data is distributed evenly from the mean. Most data is less than two standard deviations from the mean. The data are in a bell curve illustration.
The data is samples normally and is arranged in a scatter plot as a flowerpot illustration. The data is less than two standard deviations from the mean.
The data is normally collected and illustrated by a wavy curve distribution. The data are two standard deviations away from the mean with some outliers.
Question 5
8 / 8 pts
The DNP student is reading a research article in which there are 4 groups. The level of measurement is nominal and ordinal level data. The researchers measured the difference between the means. Using the interactive statistical flowchart, what statistical test did the researchers most likely conduct?
Regression Analysis
Pearson’s r test
Correct!
Kruskal-Wallis test
Spearman’s Rank Correlation
Question 6
8 / 8 pts
Type I errors occur when a researcher incorrectly __________ the ___________ hypothesis; therefore, they erroneously accept the __________ hypothesis.
none of these is the answer
Correct!
rejects the null and accepts the alternative
rejects the alternative and accepts the null
accepts the null and accepts the alternative
Question 7
8 / 8 pts
What significance level should they use to reduce the probability of the more dangerous error?
Correct!
α = 0.01
α = 0.025
α = 0.10
Question 8
0 / 8 pts
When researchers set the level of significance, they are thinking about the possibility of Type I and Type II errors. When researchers are testing the effect of chemotherapy on cancer, which of these answers below would be a consequence of a type I error?
Correct Answer
The scientists report the chemotherapy is effective when it is not effective.
You Answered
The scientists report the chemotherapy is not effective when it is effective.
The scientists report their results as inconclusive
There is no way to determine the answer in this scenario
Question 9
8 / 8 pts
The DNP student is conducting data collection at the end of the implementation cycle in his DNP project. The student also collected data before the intervention was implemented. The level of measurement is categorical and is discrete data. The student would like to measure the differences between the pre-implementation and post-implementation samples from the same population. Using the interactive statistical flowchart, what statistical test will he conduct on his data?
Correct!
Chia-Square
Bonjovi’s test
Milli’s test
Pearson’s r
Question 10
8 / 8 pts
A Ph.D. nurse performs an experiment testing the frequency and correlation of the participant demographics. She plots a histogram measuring income versus education level. She produces the following graph below. Which of the following describes this distribution?
Correct!
Normal
Bimodal
Left Skewed
Right Skewed
Question 11
8 / 8 pts
When researchers set the level of significance, they are thinking about the possibility of Type I and Type II errors. When researchers are testing the effect of chemotherapy on cancer, which of these answers below would be a consequence of a type II error?
The scientists report the chemotherapy is effective when it is not effective.
Correct!
The scientists report the chemotherapy is not effective when it is effective.
The scientists report their results as inconclusive
There is no way to determine the answer in this scenario
Question 12
8 / 8 pts
A student scores a 749 on the Scholastic Assessment Test (SAT). A college admissions committee does not know how the exam is scored; however, they do know the scores of the exam form a normal distribution pattern. They also know the mean score and standard deviation of the population of students that took the test. Using this information, determine whether or not the student scored well on the SAT.
Mean = 495
Standard deviation = 116
Correct!
The student’s score was very good and 2 standard deviations above the mean.
The student’s score was average, similar to the mean.
The student’s score was poor and below a single standard deviation of the mean.
The student’s score was good and 1 standard deviation from the mean.
Question 13
8 / 8 pts
The DNP student is reading a research article in which there are 4 groups with three different interventions. The level of measurement is ratio level data. The researchers measured the differences between the groups. Using the interactive statistical flowchart, what statistical test did the researchers most likely conduct?
John’s Relational test
Bonjovi’s test
Correct!
ANOVA
Spearman’s Rank Correlation
Question 14
8 / 8 pts
The standard deviation describes which aspect of the data sample:
Correct!
It is the amount of variation or dispersion of the data in a sample.
It illustrates the distribution curve
It describes the average data point in the sample
It approximates the absolute value of the mean
Question 15
8 / 8 pts
Which of the following is not considered to be a test statistic of a sample population?
Correct!
µ
s
s2
x̄
Question 16
8 / 8 pts
What is the mode of the following numbers: 1, 2, 4, 6, 4?
Correct!
4
6
3.4
1
Question 17
8 / 8 pts
Using the interactive statistical flowchart, the assumptions for the Student t-test are ALL the following EXCEPT:
The data must be parametric data
The data must be normally distributed
Correct!
The data is categorical (nominal data)
Equality of variances (Homogeneity of variances)
Question 18
8 / 8 pts
The Four Levels of Measurement or Types of Data are:
Nominal, Parametric, Linear, and Dichotomous
Parametric, Continuous, Skewed, Interval
Correct!
Nominal, Ordinal, Interval and Ratio
Level 1, Level 2, Level 3, Level 4
Question 19
8 / 8 pts
The mean measurement of central tendency is calculated by _____.
placing all data collected in numerical order and selecting the middle number
subtracting the lowest number from the highest number
Correct!
dividing the total sum of all of the data by the total number of data points
by selecting the most frequent data point
Question 20
8 / 8 pts
Which of these choices below are a defined collection of individuals or objects about which we want to draw conclusions?
Population
Census
Survey
Correct!
Sample
Question 21
8 / 8 pts
Which option is an example of categorical or discrete data?
Blood pressure data
A1C data
Correct!
Marriage status (married or not married)
Temperature
Question 22
8 / 8 pts
Which of the following variables is considered to be a discrete variable?
The height of the patients
The blood pressure of the patients
The temperature of the patients
Correct!
The gender of the patients
Question 23
8 / 8 pts
What is the mean (average) of the following numbers? 10,6,4,4,6,4,1
Correct!
5
4
9
6
Question 24
8 / 8 pts
The frequency distribution informs us about:
Subgroups within a dataset when the groups are divided into four equal parts
Correct!
How many times each value occurs within the sample data
The general population from which the sample was taken
The significance level
Question 25
8 / 8 pts
Type II errors occur when researcher incorrectly __________ the ___________ hypothesis; therefore, they erroneously reject the __________ hypothesis.
rejects the null and rejects the alternative
none of these is correct
accepts the alternative and rejects the null
Correct!
accepts the null and rejects the alternative